Fig. 9
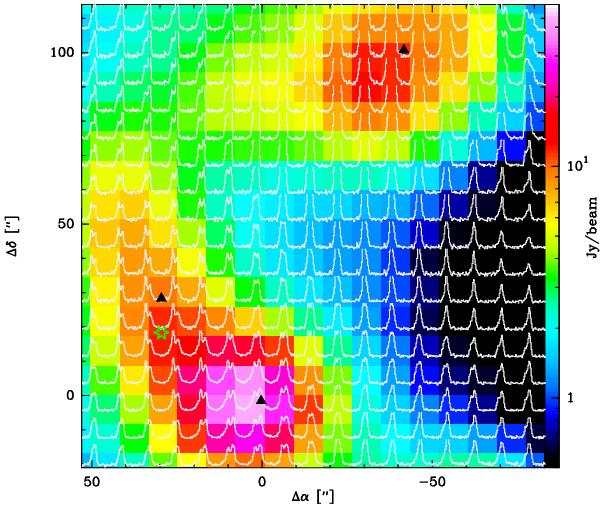
Map of the 12CO(7–6) line overlaid on the continuum emission at 870 μm from LABOCA. The velocity axis ranges from −60 to −25 km s-1, the temperature axis from −1 to 15 K. The 12CO(7–6) data were smoothed to a resolution of 18″ to match the resolution of the 12CO(3–2) data and of the LABOCA emission. The centre of the map is that of the APEX data (see Sect. 2.1). The triangles and the green star are as in Fig. 2.
Current usage metrics show cumulative count of Article Views (full-text article views including HTML views, PDF and ePub downloads, according to the available data) and Abstracts Views on Vision4Press platform.
Data correspond to usage on the plateform after 2015. The current usage metrics is available 48-96 hours after online publication and is updated daily on week days.
Initial download of the metrics may take a while.