Fig. 8
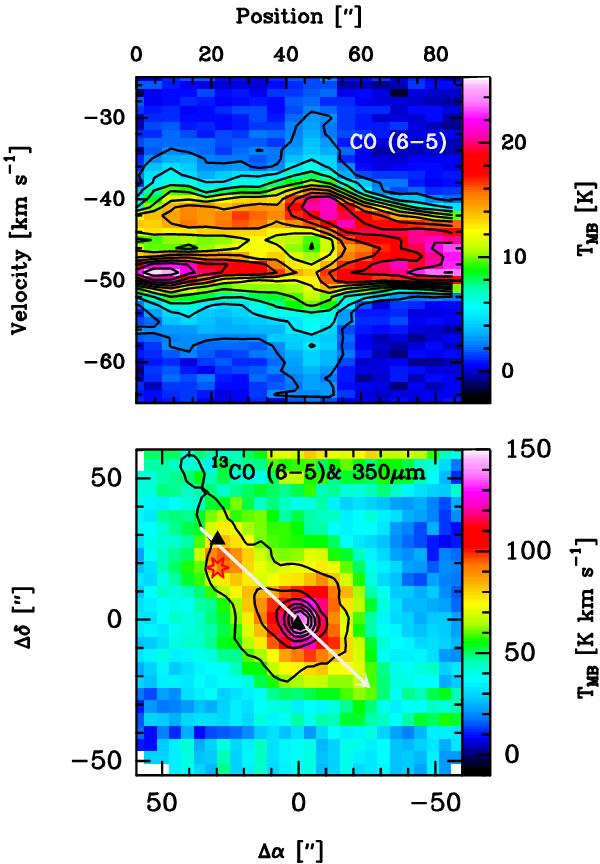
Top panel: color scale and contours show the P − V diagram of the CO(6–5) transition computed along the cut indicated by the white arrow in the bottom panel. Offset positions increase along the direction of the arrow shown in the bottom panel. Bottom panel: distribution of the integrated intensity of the 13CO(6–5) transition towards the hot core G327.3–0.6. Solid contours show the continuum emission at 350 μm (Wyrowski et al., in prep.) from 3σ in steps of 10σ (σ ~ 3 Jy/beam). Symbols are as in Fig. 2.
Current usage metrics show cumulative count of Article Views (full-text article views including HTML views, PDF and ePub downloads, according to the available data) and Abstracts Views on Vision4Press platform.
Data correspond to usage on the plateform after 2015. The current usage metrics is available 48-96 hours after online publication and is updated daily on week days.
Initial download of the metrics may take a while.