Free Access
Fig. 4
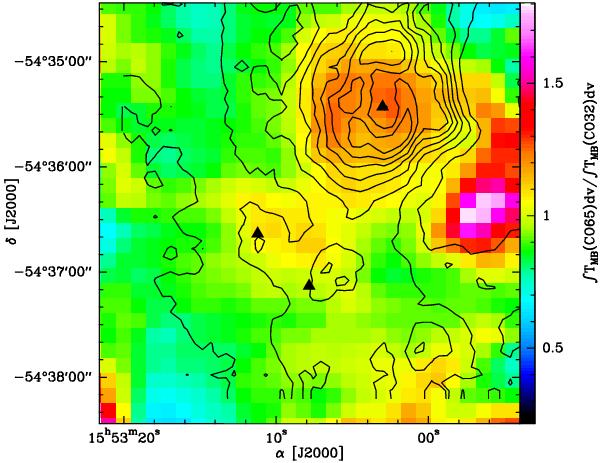
Distribution of the line ratio of the 12CO(6–5) transition to the 12CO(3–2) line. Solid contours show the 12CO(6–5) integrated intensity in the velocity range vLSR = [−54, −40] km s-1 from 20% of the peak value in steps of 10%. The black triangles are as in Fig. 2.
Current usage metrics show cumulative count of Article Views (full-text article views including HTML views, PDF and ePub downloads, according to the available data) and Abstracts Views on Vision4Press platform.
Data correspond to usage on the plateform after 2015. The current usage metrics is available 48-96 hours after online publication and is updated daily on week days.
Initial download of the metrics may take a while.