Fig. 3
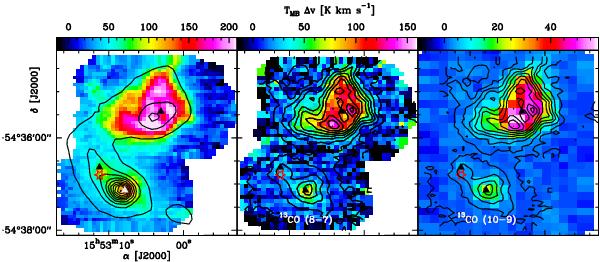
Maps of the integrated intensity of the 13CO(6–5), (8–7) and (10–9) transitions in the velocity range vLSR = [−54, −40] km s-1 (colour scale). The solid contours in the left panel represent the LABOCA continuum emission at 870 μm from 5% of the peak emission in steps of 10% (Schuller et al. 2009). In the middle and right panels, the solid contours are the integrated intensity of the 13CO(6–5) from 20% of the peak emission in steps of 10%. In each panel, the positions analysed in Sect. 4.2 (the hot core, the IRDC position, and the centre of the Hii region) are marked with black triangles (except in the left panel, where the hot core is shown by a white triangle). The red star labels the position of the EGO.
Current usage metrics show cumulative count of Article Views (full-text article views including HTML views, PDF and ePub downloads, according to the available data) and Abstracts Views on Vision4Press platform.
Data correspond to usage on the plateform after 2015. The current usage metrics is available 48-96 hours after online publication and is updated daily on week days.
Initial download of the metrics may take a while.