Fig. 16
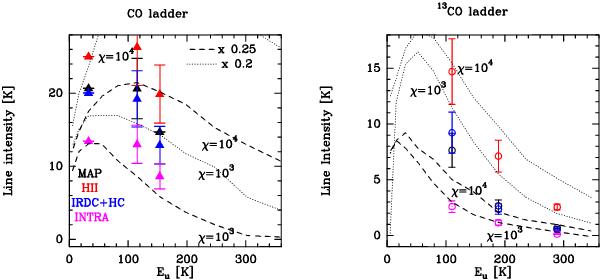
CO (left) and 13CO (right) ladders for the whole mapped region (black), the Hii region G327.3–0.5 (red), the IRDC including the hot core (blue) and the inter-clump gas (magenta). Error bars include only calibration uncertainties. In both panels, the dashed and dotted curves represent the predicted intensities for model B from Koester et al. (1994) for a density of 107 cm-3, incident UV fields of 103 and 104 relative to the average interstellar field, a visual extinction of 10, and a Doppler broadening of 3 (dashed curve) and 1 km s-1 (dotted curve).
Current usage metrics show cumulative count of Article Views (full-text article views including HTML views, PDF and ePub downloads, according to the available data) and Abstracts Views on Vision4Press platform.
Data correspond to usage on the plateform after 2015. The current usage metrics is available 48-96 hours after online publication and is updated daily on week days.
Initial download of the metrics may take a while.