Fig. 14
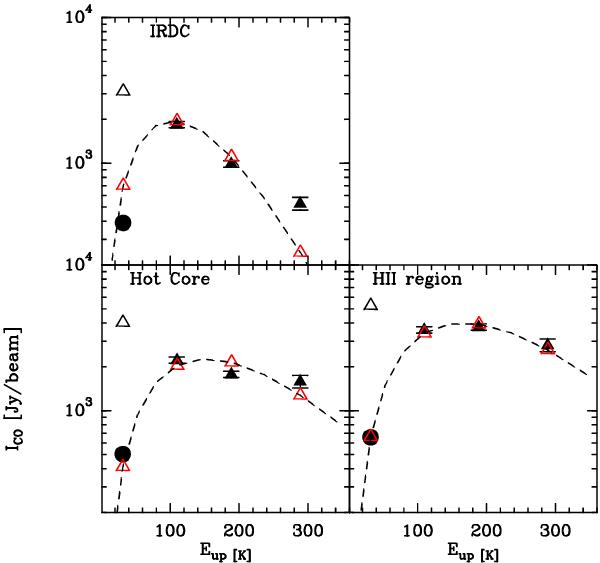
Distribution of the 13CO peak line intensities. Full black triangles correspond to 13CO(6–5), (8–7) and (10–9) observed intensities. The circle represents the observed C18O(3–2) flux, the empty black triangle the flux of the C18O(3–2) line multiplied by X13CO/C18O ~ 8. The red triangles are the best model fit results. The error bars include only calibration uncertainties. The dashed lines represent the best fit 13CO ladder.
Current usage metrics show cumulative count of Article Views (full-text article views including HTML views, PDF and ePub downloads, according to the available data) and Abstracts Views on Vision4Press platform.
Data correspond to usage on the plateform after 2015. The current usage metrics is available 48-96 hours after online publication and is updated daily on week days.
Initial download of the metrics may take a while.