Free Access
Fig. 13
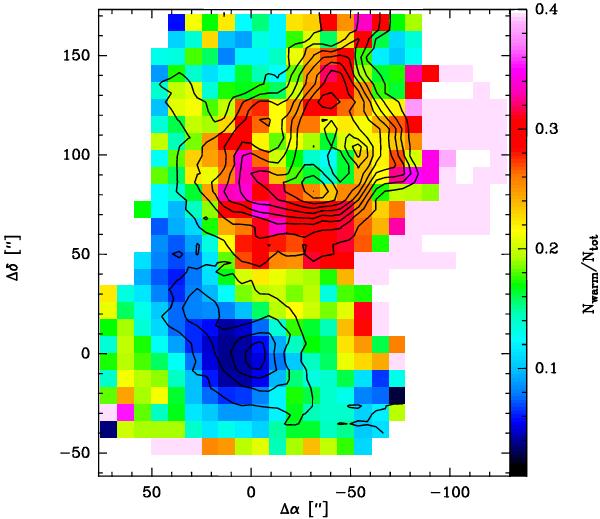
Distribution of the ratio between the column density of warm gas (traced by 12CO and 13CO(6–5)) and the total H2 column density (traced by the continuum emission at 870 μm) in the G327.3–0.6 star-forming region. Black contours are the 13CO(6–5) integrated intensity as in Fig. 3.
Current usage metrics show cumulative count of Article Views (full-text article views including HTML views, PDF and ePub downloads, according to the available data) and Abstracts Views on Vision4Press platform.
Data correspond to usage on the plateform after 2015. The current usage metrics is available 48-96 hours after online publication and is updated daily on week days.
Initial download of the metrics may take a while.