Fig. 1
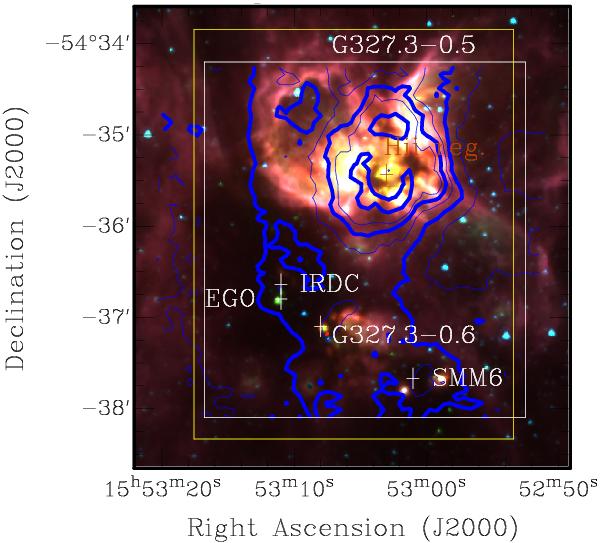
Spitzer infrared colour image of the region G327.3–0.6 with red representing 8.0 μm, green 4.5 μm and blue 3.6 μm. The blue contours represent the integrated intensity of the 12CO(6–5) line (thin contours are 15%, 45% and 70% of the peak emission, thick contours 30%, 60% and 90% of the peak emission). The sources discussed in this paper (the IRDC, the EGO, the hot core G327.3–0.6, the SMM6 position and the Hii region G327.3–0.5) are also marked with crosses. The white and yellow boxes mark the regions mapped with APEX and Herschel, respectively.
Current usage metrics show cumulative count of Article Views (full-text article views including HTML views, PDF and ePub downloads, according to the available data) and Abstracts Views on Vision4Press platform.
Data correspond to usage on the plateform after 2015. The current usage metrics is available 48-96 hours after online publication and is updated daily on week days.
Initial download of the metrics may take a while.