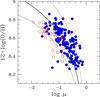
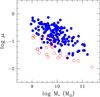
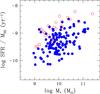
Fig. 10

Left: the oxygen abundance versus the logarithm of the gas fraction from observed galaxies compared with the prediction of the closed-box model (solid black line) together with the 1σ limits (dashed black line). Middle: the logarithm of the gas fraction versus the stellar mass. Right: the ratio of the SFR(NUV) to the mass of Hi versus the stellar mass. In all three plots, Hi normal and Hi deficient galaxies are plotted as solid blue and open red circles, respectively.
Current usage metrics show cumulative count of Article Views (full-text article views including HTML views, PDF and ePub downloads, according to the available data) and Abstracts Views on Vision4Press platform.
Data correspond to usage on the plateform after 2015. The current usage metrics is available 48-96 hours after online publication and is updated daily on week days.
Initial download of the metrics may take a while.