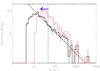
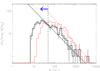
Fig. 6
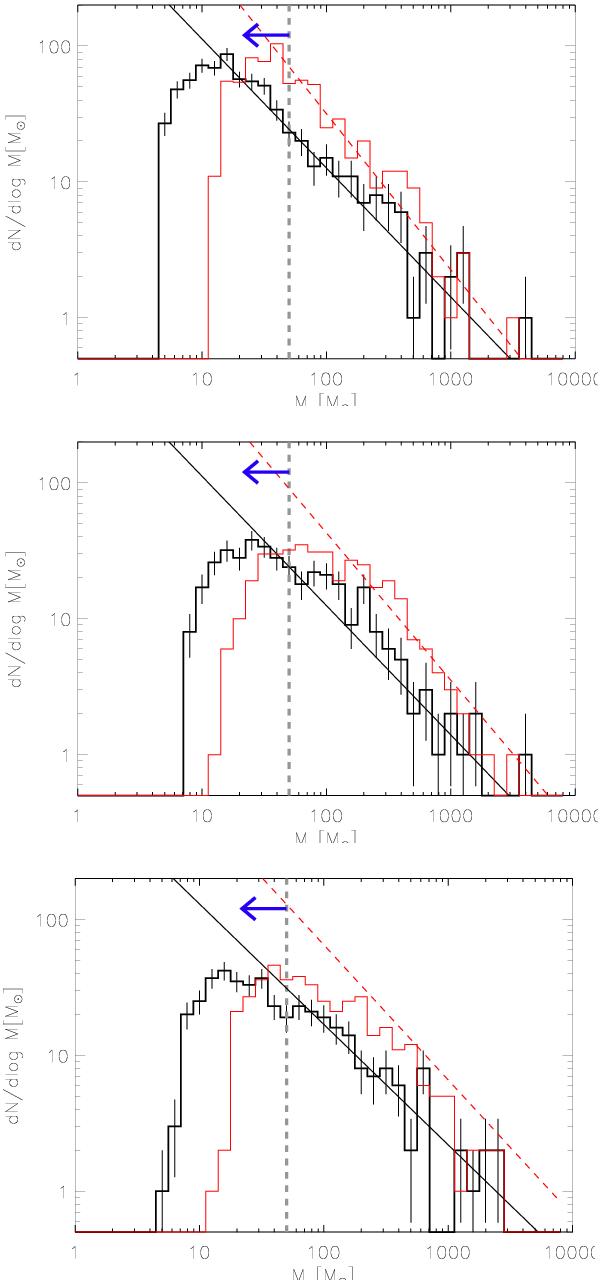
Mass histograms derived with the three different clump-finding algorithms CLUMPFIND (top), GAUSSCLUMPS (middle) and SExtractor (bottom). The black lines show the samples and their power-law slopes with the temperatures derived from the relation we got from Peretto et al. (2010). The dashed gray line shows the used lower cut-off limit for these samples. For the red line we assumed a constant temperature of 10 K for all clumps. If we assume a constant temperature of 20 K the slope does not change, but the mass distribution is shifted to lower masses (blue arrow).
Current usage metrics show cumulative count of Article Views (full-text article views including HTML views, PDF and ePub downloads, according to the available data) and Abstracts Views on Vision4Press platform.
Data correspond to usage on the plateform after 2015. The current usage metrics is available 48-96 hours after online publication and is updated daily on week days.
Initial download of the metrics may take a while.