Fig. 5
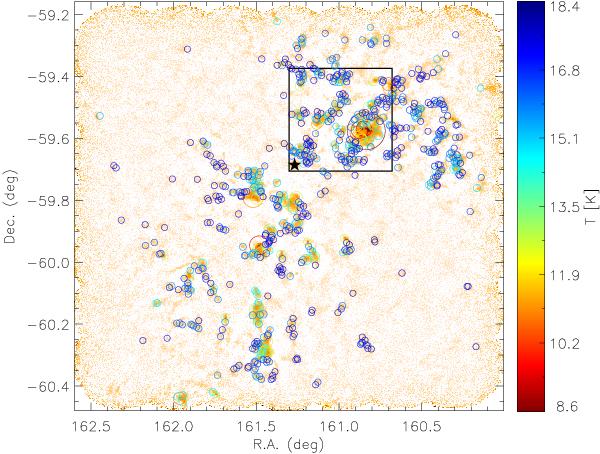
Temperatures and fluxes of the CLUMPFIND sample, overplotted on the LABOCA map. The color of the circles corresponds to the calculated temperatures and the size of the circles to the measured flux (~2−373 Jy/beam). The position of η Car is marked by the black star. The black box represents the region shown in Fig. 1, centered around Tr 14 (RA(J2000) = 161°, Dec (J2000) = − 59 6).
6).
Current usage metrics show cumulative count of Article Views (full-text article views including HTML views, PDF and ePub downloads, according to the available data) and Abstracts Views on Vision4Press platform.
Data correspond to usage on the plateform after 2015. The current usage metrics is available 48-96 hours after online publication and is updated daily on week days.
Initial download of the metrics may take a while.