Fig. 1
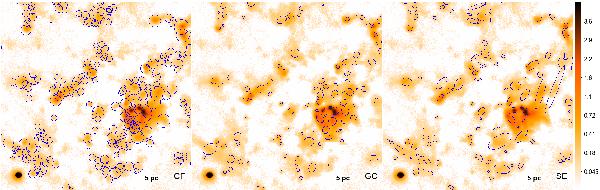
A 20 arcmin wide detail from our LABOCA map at 870 μm of the Tr 14 region in the Carina nebula complex with the positions of the clumps found with the different clump-finding algorithms. The units of the scale bar on the right are Jy/beam. In the left panel the CLUMPFIND sample is shown with circles of the effective radial size of the clumps calculated by the algorithm. The GAUSSCLUMPS (middle panel) and SExtractor (right panel) samples are shown as ellipses. The sizes of their axes correspond to the rms deviations. The bright source in the lower left corner is the luminous blue variable η Car.
Current usage metrics show cumulative count of Article Views (full-text article views including HTML views, PDF and ePub downloads, according to the available data) and Abstracts Views on Vision4Press platform.
Data correspond to usage on the plateform after 2015. The current usage metrics is available 48-96 hours after online publication and is updated daily on week days.
Initial download of the metrics may take a while.