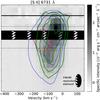
Fig. 2
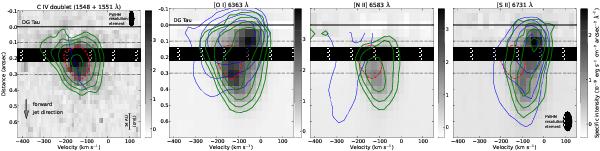
PVDs of important diagnostic lines with associated contours. The red dashed contour indicates the C iv emission and the horizontal dotted lines give the peak location of the two optical knots. The shaded area indicates the centroid of the inner X-ray jet (spatial extent:  ), the blue line visualizes the velocity of the C iv emission, and the blue contours pertain to the central jet emission in the 1999 STIS data. Contours start at 7 × 10-14 erg s-1 cm-2 Å-1 (increase by
  ) and at 2.5 × 10⁻¹⁴ erg s-1 cm-2 Å-1 (increase by a factor of 2) for C iv and optical emission, respectively.
Current usage metrics show cumulative count of Article Views (full-text article views including HTML views, PDF and ePub downloads, according to the available data) and Abstracts Views on Vision4Press platform.
Data correspond to usage on the plateform after 2015. The current usage metrics is available 48-96 hours after online publication and is updated daily on week days.
Initial download of the metrics may take a while.