Fig. 1
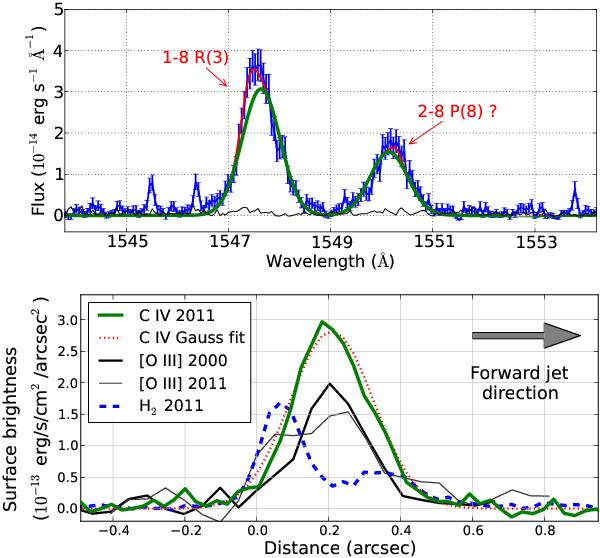
Top: spectrum extracted between 0 15...03. The green line describes the Gaussian fit to the C iv emission, the red curve includes the H2 contamination. Bottom: C iv and H2 flux along the jet axis summed between –400 to 0 km s-1 for the C iv emission and –80 to 0 km s-1 for the H2 lines in our FUV spectrum. Included is [O iii] λ5007 emission seen in short G430L spectra.
Current usage metrics show cumulative count of Article Views (full-text article views including HTML views, PDF and ePub downloads, according to the available data) and Abstracts Views on Vision4Press platform.
Data correspond to usage on the plateform after 2015. The current usage metrics is available 48-96 hours after online publication and is updated daily on week days.
Initial download of the metrics may take a while.