Free Access
Fig. 9
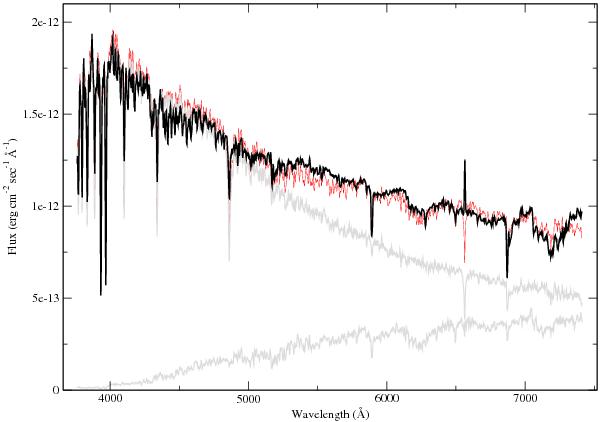
Observed low-resolution spectrum of V383 Sco (thick line) compared with the model (thin line) that is a superposition of F0 and M1 supergiant spectra (grey lines). The observed spectrum and the model are dereddened by EB − V = 0.5.
Current usage metrics show cumulative count of Article Views (full-text article views including HTML views, PDF and ePub downloads, according to the available data) and Abstracts Views on Vision4Press platform.
Data correspond to usage on the plateform after 2015. The current usage metrics is available 48-96 hours after online publication and is updated daily on week days.
Initial download of the metrics may take a while.