Fig. 15
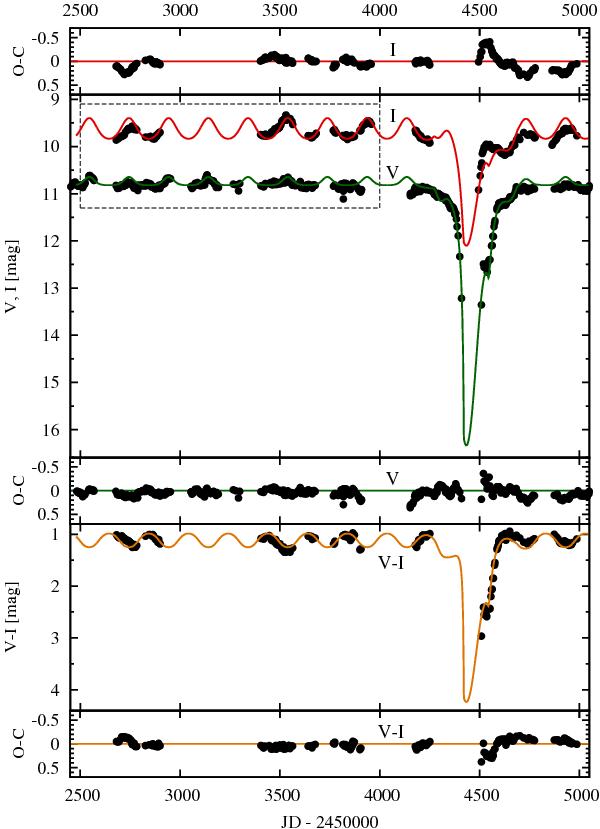
Synthetic V- and I-band light curve and V − I colour index curves obtained by modelling, plotted with solid lines (green, red, and orange, respectively in the electronic version of this paper), in comparison with observational photometric data. Between the flux and colour curves, residuals are shown. The model assumes a temperature of the cool star Tcool = 2800 K. The expanded view of the out-of-eclipse V and I light curves (box with a dashed line) is shown in Fig. 16.
Current usage metrics show cumulative count of Article Views (full-text article views including HTML views, PDF and ePub downloads, according to the available data) and Abstracts Views on Vision4Press platform.
Data correspond to usage on the plateform after 2015. The current usage metrics is available 48-96 hours after online publication and is updated daily on week days.
Initial download of the metrics may take a while.