Fig. 9
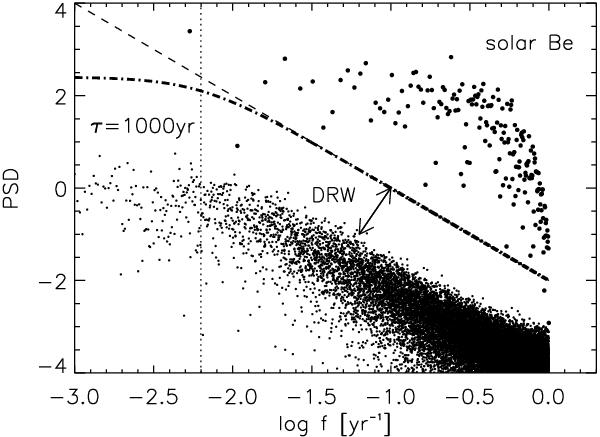
PSD comparison of the solar 10Be data (large dots) and a DRW model (smaller dots) with τ = 1000 years (indicated by the dotted line). A DRW process has a spectral index of − 2 on short time scales (shown by the dashed line), which is shallower than that for the 10Be data on short time scales. The dotted-dashed line shows the average PSD for many DRW models with τ = 1000 years.
Current usage metrics show cumulative count of Article Views (full-text article views including HTML views, PDF and ePub downloads, according to the available data) and Abstracts Views on Vision4Press platform.
Data correspond to usage on the plateform after 2015. The current usage metrics is available 48-96 hours after online publication and is updated daily on week days.
Initial download of the metrics may take a while.