Fig. 11
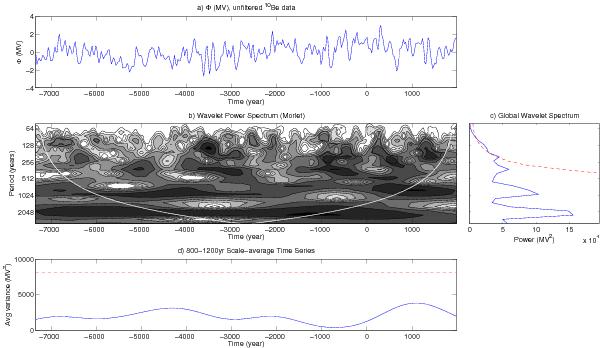
Wavelet analysis of the solar 10Be data using the Morlet wavelet. a) Time series of solar modulation function (Φ) anomalies from unfiltered 10Be data. b) Wavelet power spectrum: darker contours indicate the higher values of wavelet power. White thin line is the cone of influence, below which edge effects become important. c) Global wavelet power spectrum, i.e., the temporal mean wavelet power at each period. Dashed line is the 95% confidence level. d) Scale-averaged time series for the period band 800 − 1200 years. Dashed line is the 95% confidence level. For more information about wavelet analysis, see Torrence & Compo (1998).
Current usage metrics show cumulative count of Article Views (full-text article views including HTML views, PDF and ePub downloads, according to the available data) and Abstracts Views on Vision4Press platform.
Data correspond to usage on the plateform after 2015. The current usage metrics is available 48-96 hours after online publication and is updated daily on week days.
Initial download of the metrics may take a while.