Fig. 1
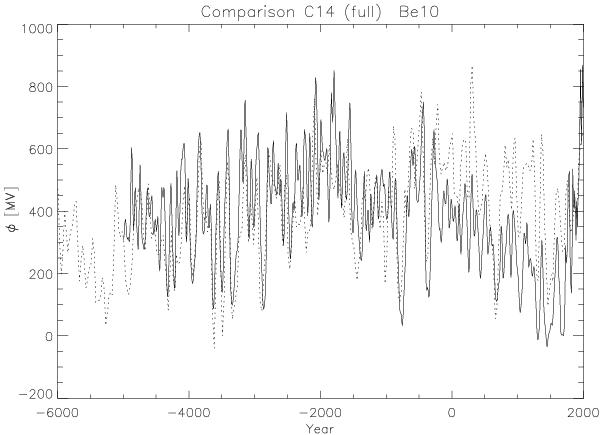
Time series of reconstructed solar activity (Φ) based on 14C (full line) and 10Be measurements (dotted line). Years are given in calendar AD years. The data points correspond to centers of the 25-year intervals. Negative values on the y-axis are artifacts and are consistent with zero within the error limits due to uncertainty in measuring 10Be and in geomagnetic field intensity.
Current usage metrics show cumulative count of Article Views (full-text article views including HTML views, PDF and ePub downloads, according to the available data) and Abstracts Views on Vision4Press platform.
Data correspond to usage on the plateform after 2015. The current usage metrics is available 48-96 hours after online publication and is updated daily on week days.
Initial download of the metrics may take a while.