Fig. 7
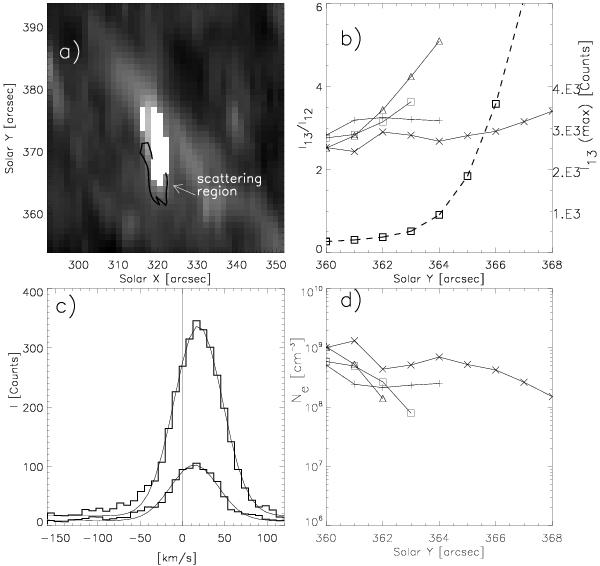
Panel a) shows the C iv 1548 Å intensity image of the microflare. The isocontours delineate the scattering region but do not overlap with the white, over-exposed area. Panel b) shows the lines ratio across the scattering region along the slit from Solar Y = 360′′ to 368′′ for four slit positions. Curves with x-crosses triangles, squares and crosses correspond to values selected at the Solar X = 318′′, 319′′, 320′′ and 321′′ slit positions, respectively. Moreover, in Panel b), the dashed line shows the peak intensity of the C iv 1548 Å line profiles from Solar Y = 360′′ to 368′′ at Solar X = 319′′. Panel c) shows the individual profiles (histogram lines) of the C iv 1548 Å and 1550 Å lines from the same spatial pixel of the scattering region with the Gaussian fit. Panel d) shows the calculated electron density according to Eq. (5) for the line ratios of panel b).
Current usage metrics show cumulative count of Article Views (full-text article views including HTML views, PDF and ePub downloads, according to the available data) and Abstracts Views on Vision4Press platform.
Data correspond to usage on the plateform after 2015. The current usage metrics is available 48-96 hours after online publication and is updated daily on week days.
Initial download of the metrics may take a while.