Fig. 6
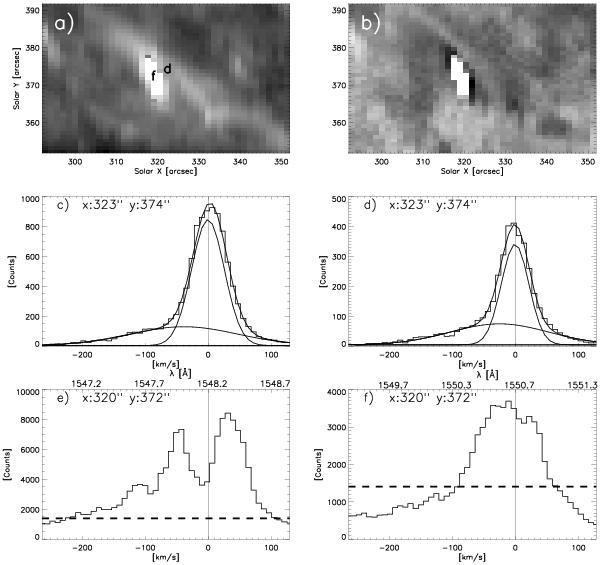
Panels a) and b) show the C iv 1550 Å intensity and dopplergram, respectively. The other panels show individual spectral profiles of the C iv 1548 Å line (panels c) and e)) and C iv 1550 Å (panels d) and f)) lines. The position of the profile in arcseconds is shown at the top left of each panel and is indicated with letters (corresponding to the panels) in the intensity image. The histogram line represents the data. In panels c) and d), the solid lines represent the fit function and the two Gaussian components. In panels e) and f), the profiles are recorded in the central bright area. The detector is over-exposed for the parts of the profiles above the horizontal dashed lines. The non-overexposed part of these profiles, shows blueshifts on the order of –200 km s-1 at the microflare.
Current usage metrics show cumulative count of Article Views (full-text article views including HTML views, PDF and ePub downloads, according to the available data) and Abstracts Views on Vision4Press platform.
Data correspond to usage on the plateform after 2015. The current usage metrics is available 48-96 hours after online publication and is updated daily on week days.
Initial download of the metrics may take a while.