Fig. 4
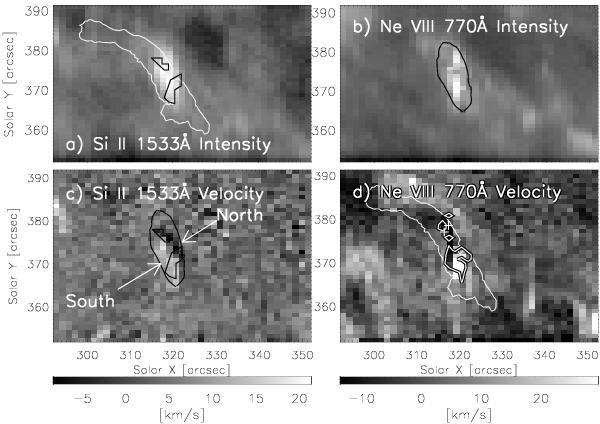
Intensity maps and dopplergrams of the Si ii 1533 Å line in Panels a) and c) and of the Ne viii 770 Å line in Panels b) and d). Each panel size is of 60″ × 40″ centered on the bright area at the footpoint B of the 171 Å loops. In Panels a) and d), the 171 Å intensity isocontour of the microflare loops (see Fig. 2b) is overplotted in white. Moreover, the two regions with black isocontours show the areas where the Si ii line has self-reversed spectral profiles. In Panels b) and c), the black isocontour corresponds to the Si ii 1533 Å intensity. In the dopplergrams, the bright area is separated in a blueshifted north part (black) and a redshifted south part (white) indicated with arrows in Panel c). Over the bright area, two Gaussian components are required to fit the Ne VIII profiles. Thus, in panels b) and d), the intensities and Doppler shifts above this area are those from the high intensity and narrower component (see text). In Panel d), the white isocontour indicates the parts where the secondary low intensity component is redshifted while the two crosses show the only pixels where the secondary component is blueshifted. Intensities are in logarithmic scale.
Current usage metrics show cumulative count of Article Views (full-text article views including HTML views, PDF and ePub downloads, according to the available data) and Abstracts Views on Vision4Press platform.
Data correspond to usage on the plateform after 2015. The current usage metrics is available 48-96 hours after online publication and is updated daily on week days.
Initial download of the metrics may take a while.