Fig. 3
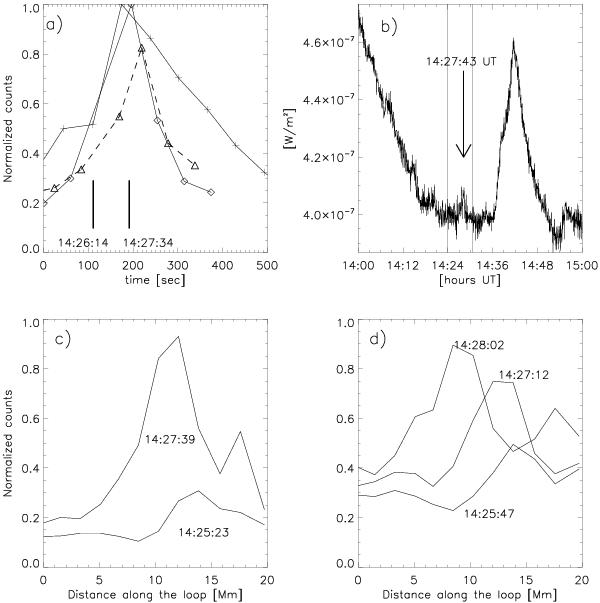
Panel a) shows the light curves from 171 Å (solid line with diamonds), 195 Å (dashed line with triangles), and from Hα (solid line with crosses) filtergrams. The vertical segments show the duration of SUMER observation. Panel b) shows the GOES 8 flux in the 1–8 Å band. The time duration of Panel a) is shown as two vertical segments while an arrow is pointing at the microflare event at 14:27:43 UT. Panel c) shows the 171 Å intensity distribution along the TRACE loops (see Fig. 2b) for two different times. The x-axis shows the distance along the loop where zero is at the east (A) footpoint and the maximum value at the west (B) footpoint. Panel d) shows the 195 Å intensity variation at three different times. Panels c) and d) show bright structures moving from the west to the east footpoints interpreted as mass motions from which we measure velocities of 20 km s-1 to 70 km s-1.
Current usage metrics show cumulative count of Article Views (full-text article views including HTML views, PDF and ePub downloads, according to the available data) and Abstracts Views on Vision4Press platform.
Data correspond to usage on the plateform after 2015. The current usage metrics is available 48-96 hours after online publication and is updated daily on week days.
Initial download of the metrics may take a while.