Fig. 2
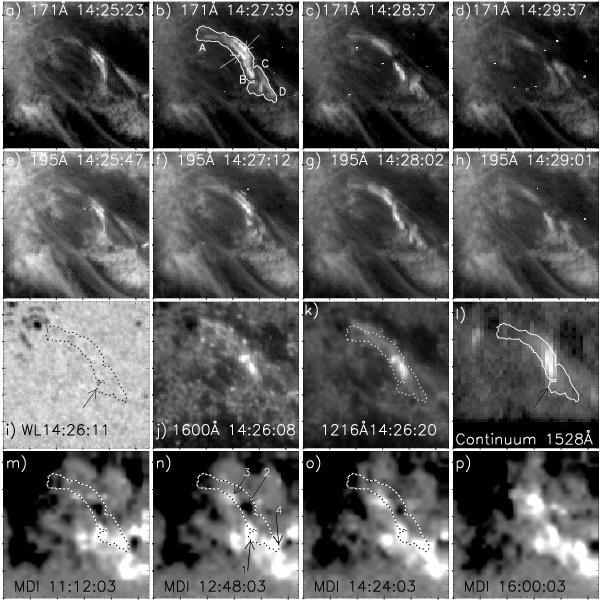
Evolution of the flaring loops as seen in the 171 Å (first row) and 195 Å (second row) filtergrams. In Panel b), the isocontour defines the maximum area reached by the bright loops. Two arrows are pointing to the main flaring loops while the letters A and B to their east and west footpoints, respectively. Letters C and D mark the size of a secondary structure activated during the microflare. The third row shows the TRACE white light (Panel i)), 1600 Å (Panel j)), and 1216 Å (Panel k)) filtergrams and the SUMER recorded continuum in the 1527 Å to 1528 Å range (Panel l)). The last row shows the four MDI magnetograms recorded from 11:12 to 16:00. In Panel m), the dotted curve represents the flaring loops as in Panel b). In Panel n), four numbered arrows are pointing to the magnetic structures under the microflare as explained in the text. The bright feature in Panels j), k), and l) corresponds to the loops west footpoint-A as seen by the overplotted 171-loops isocontours. An arrow is pointing to a dark pore (Panel i)) cospatial to a positive magnetic structure (Panel n)), and cospatial to the scattering region (Panel l)) that is presented in Sect. 3.4. The size of each image is of 55″ × 55″ and the EUV intensities are in logarithmic scale.
Current usage metrics show cumulative count of Article Views (full-text article views including HTML views, PDF and ePub downloads, according to the available data) and Abstracts Views on Vision4Press platform.
Data correspond to usage on the plateform after 2015. The current usage metrics is available 48-96 hours after online publication and is updated daily on week days.
Initial download of the metrics may take a while.