Fig. 1
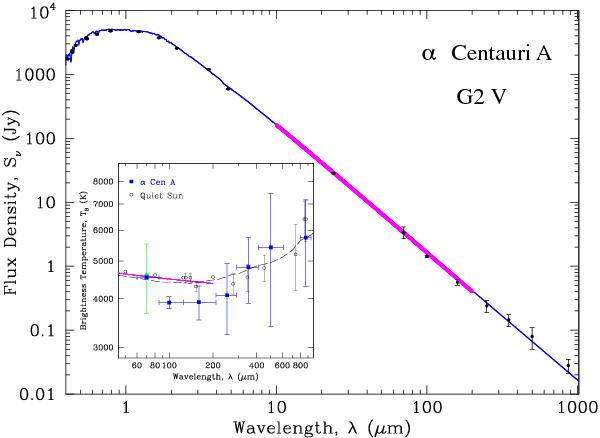
The SED of α Cen A, where the blue line represents the PHOENIX model photosphere (computed up to λ = 45 μm and Rayleigh-Jeans extrapolated beyond) and the thick (purple) line the Uppsala model photosphere (extending to λ = 200 μm). Photometric data are shown with their 1σ error bar estimates (Table 1). The inset shows the brightness temperature of α Cen A (squares) and the Quiet Sun (circles) in the far infrared and submm. The solar data from the compilations by Gu et al. (1997) and Loukitcheva et al. (2004) are shown together with a semi-empirical chromosphere model for the Sun (Vernazza et al. 1981, black dashes: VAL IIIC). At 70 μm, the symbol with the larger error bar (green) represents the Spitzer-MIPS datum and filled (blue) squares Herschel-PACS/SPIRE and LABOCA data. Horizontal bars indicate filter widths.
Current usage metrics show cumulative count of Article Views (full-text article views including HTML views, PDF and ePub downloads, according to the available data) and Abstracts Views on Vision4Press platform.
Data correspond to usage on the plateform after 2015. The current usage metrics is available 48-96 hours after online publication and is updated daily on week days.
Initial download of the metrics may take a while.