Fig. 7
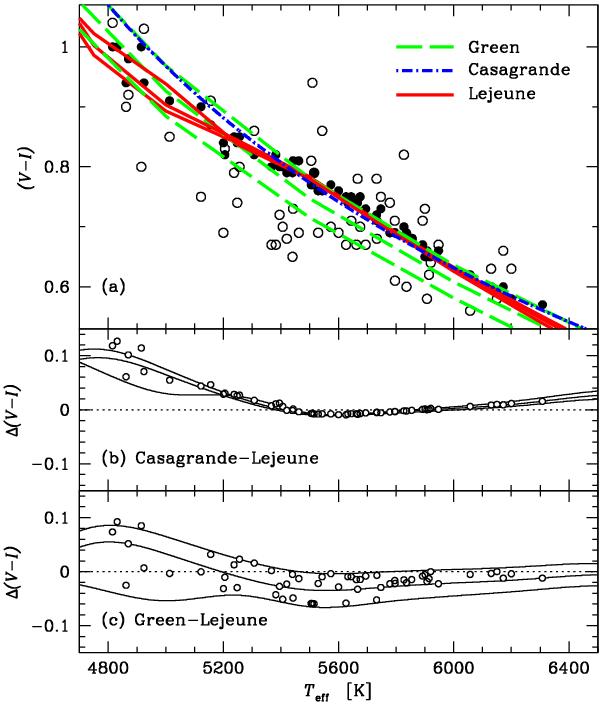
a) Filled black circles mark the spectroscopic values, open circles microlensing values. Dash-dotted blue line show the Casagrande et al. (2010)Teff-colour transformation, dashed green lines the Green et al. (1987) transformation (for three different log g), and the solid red lines the Lejeune et al. (1998) transformation (for three different log g). b) Differences between Casagrande et al. (2010) and Lejeune et al. (1998). c) Differences between Green et al. (1987) and Lejeune et al. (1998). The markers in b) and c) show the differences that should be applied to the microlensed dwarfs if the Casagrande et al. (2010) and Green et al. (1987) trandformations had been applied instead of the one from Lejeune et al. (1998).
Current usage metrics show cumulative count of Article Views (full-text article views including HTML views, PDF and ePub downloads, according to the available data) and Abstracts Views on Vision4Press platform.
Data correspond to usage on the plateform after 2015. The current usage metrics is available 48-96 hours after online publication and is updated daily on week days.
Initial download of the metrics may take a while.