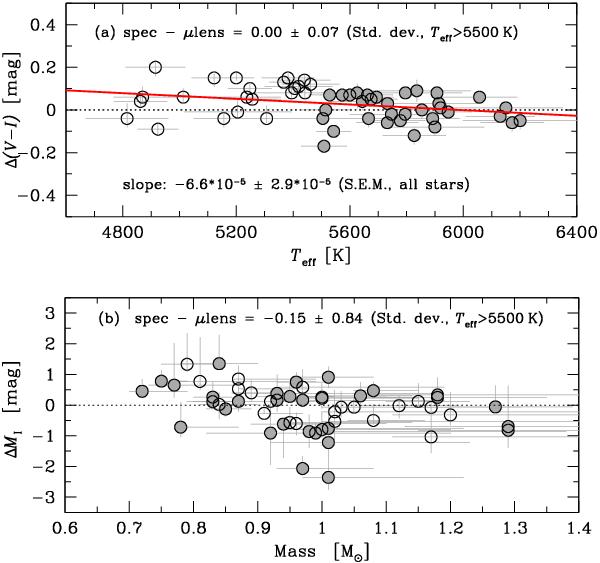
Fig. 5

a) Difference between microlensing colours and the spectroscopic colours versus spectroscopic Teff. b) Difference between the absolute I magnitudes from microlensing techniques and from spectroscopy versus stellar mass (derived from spectroscopy). Error bars represent the uncertainties in the spectroscopic values. The microlensing values used in the plots are based on the assumption that the bulge red clump has (V − I)0 = 1.06 and MI = −0.12. Stars with Teff > 5500 K are marked by filled circles, otherwise by open circles.
Current usage metrics show cumulative count of Article Views (full-text article views including HTML views, PDF and ePub downloads, according to the available data) and Abstracts Views on Vision4Press platform.
Data correspond to usage on the plateform after 2015. The current usage metrics is available 48-96 hours after online publication and is updated daily on week days.
Initial download of the metrics may take a while.


