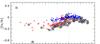
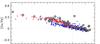
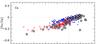
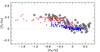
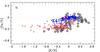
Fig. 27
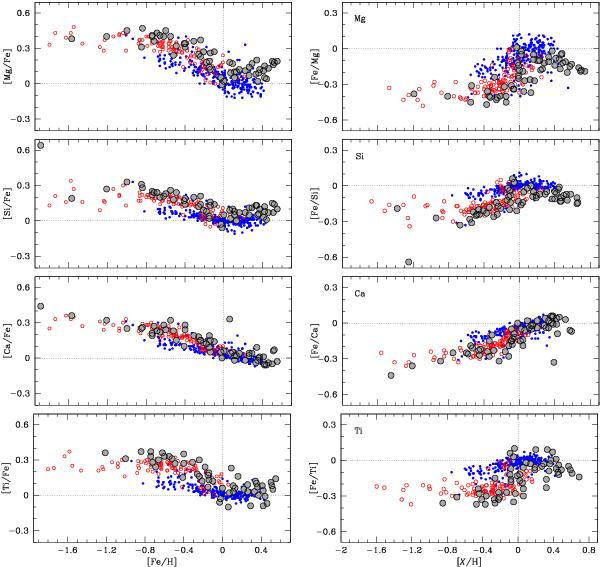
Abundance trends for the α-elements Mg, Si, Ca, and Ti. Left-hand-side panels show [X/Fe] versus [Fe/H], and right-hand panels show [Fe/X] versus [X/H]. Filled grey circles mark the microlensed bulge dwarfs and the red and blue circles are nearby thick and thin disk dwarf stars, respectively (from Bensby et al. 2003, 2005, and in prep.).
Current usage metrics show cumulative count of Article Views (full-text article views including HTML views, PDF and ePub downloads, according to the available data) and Abstracts Views on Vision4Press platform.
Data correspond to usage on the plateform after 2015. The current usage metrics is available 48-96 hours after online publication and is updated daily on week days.
Initial download of the metrics may take a while.