Fig. 19
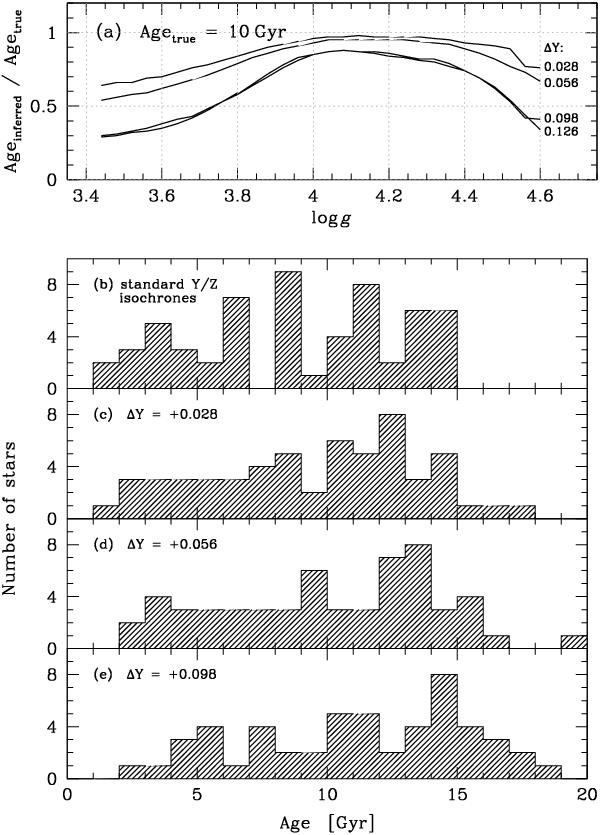
a) shows the predicted ratios (taken from Table 1 in Nataf & Gould (2012) for a true age of 10 Gyr) between the inferred spectroscopic age and the true age versus surface gravity for four different increases of the He abundance (ΔY, as indicated on the right-hand side). b) shows the age distribution for the microlensed dwarf sample. c) − e) show how the age distribution changes with ΔY if the ages are corrected following the relationships in a).
Current usage metrics show cumulative count of Article Views (full-text article views including HTML views, PDF and ePub downloads, according to the available data) and Abstracts Views on Vision4Press platform.
Data correspond to usage on the plateform after 2015. The current usage metrics is available 48-96 hours after online publication and is updated daily on week days.
Initial download of the metrics may take a while.