Fig. 13
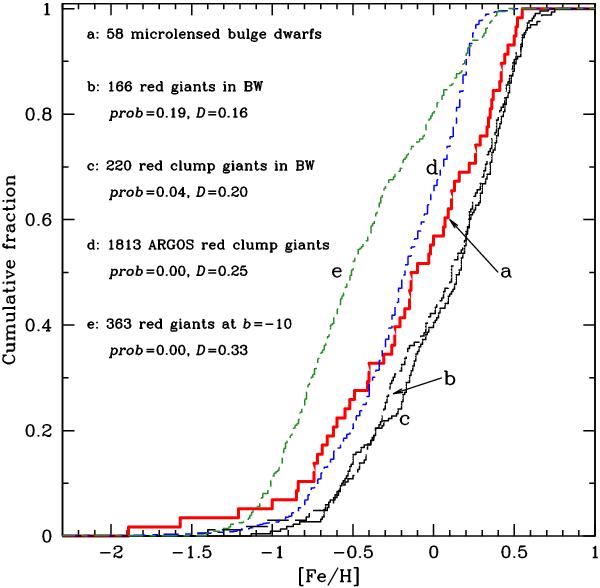
Cumulative histograms and the Kolmogorov-Smirnow tests between the microlensed dwarf sample and the giant star samples shown in Fig. 12. The solid thicker red line shows the microlensed bulge dwarfs, (b) the RGB sample from Hill et al. (2011), (c) the red clump sample from Hill et al. (2011), (d) the red clump sample from ARGOS (Ness et al., submitted), and (e) the RGB sample from Uttenthaler et al. (2012).
Current usage metrics show cumulative count of Article Views (full-text article views including HTML views, PDF and ePub downloads, according to the available data) and Abstracts Views on Vision4Press platform.
Data correspond to usage on the plateform after 2015. The current usage metrics is available 48-96 hours after online publication and is updated daily on week days.
Initial download of the metrics may take a while.