Fig. 12
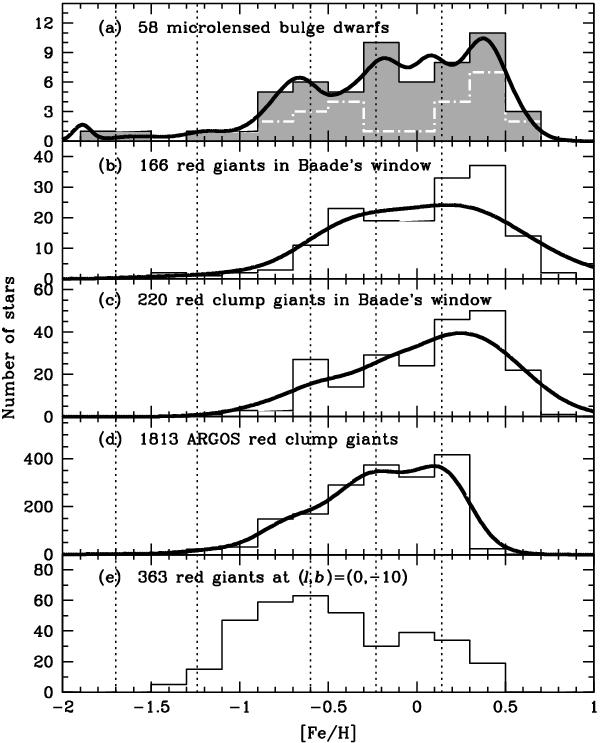
a) Metallicity distribution for the microlensed dwarf sample (white dashed line shows the distribution of the 26 microlensed dwarf stars from Bensby et al. 2011); b) 166 red giant stars in Baade’s window from Hill et al. (2011); c) 220 red clump stars in Baade’s window from Hill et al. (2011); d) 1813 red giant stars with from the ARGOS survey fields at (l,b) = (0, −5), (5, −5), (−5, −5) from Ness et al. (submitted). e) 363 red giants at (l,b) = (0, −10) from Uttenthaler et al. (2012); The curved lines in a)–d) represent generalised histograms. Dotted vertical lines mark the peaks claimed by Ness et al. (submitted) in d).
Current usage metrics show cumulative count of Article Views (full-text article views including HTML views, PDF and ePub downloads, according to the available data) and Abstracts Views on Vision4Press platform.
Data correspond to usage on the plateform after 2015. The current usage metrics is available 48-96 hours after online publication and is updated daily on week days.
Initial download of the metrics may take a while.