Fig. 11
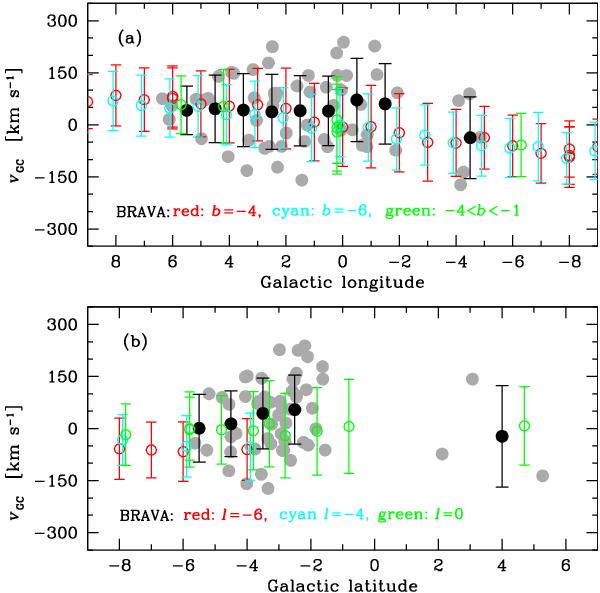
Galactocentric velocity versus Galactic longitude and latitude for the microlensed dwarf sample (grey circles). The black circles represent the mean radial velocity and the 1σ rms dispersion for the microlensed bulge dwarfs, binned into 3° wide bins. The results from the BRAVA survey (Rich et al. 2007; Kunder et al. 2012) have been over-plotted, and the different colours (red, cyan, and green) represent the values at different l and b as given in the plots.
Current usage metrics show cumulative count of Article Views (full-text article views including HTML views, PDF and ePub downloads, according to the available data) and Abstracts Views on Vision4Press platform.
Data correspond to usage on the plateform after 2015. The current usage metrics is available 48-96 hours after online publication and is updated daily on week days.
Initial download of the metrics may take a while.