Fig. 3
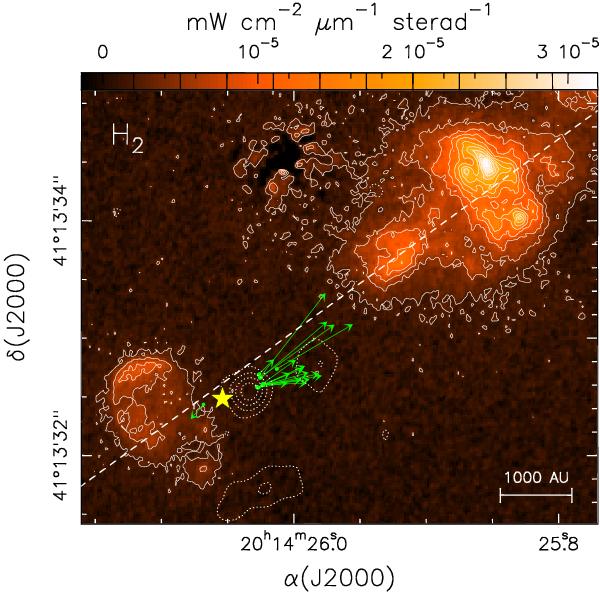
H2 line emission from the IRAS 20126+4104 region, with overlayed the 3.6 cm continuum map (dotted contours) from Hofner et al. (2007) and the H2O maser spots (green points) with associated proper motions (arrows) from Moscadelli et al. (2011). The solid contours correspond to the intensity levels marked in the colour scale on top of the figure. The yellow star marks the nominal position of the protostar, obtained from the model fit of Moscadelli et al. (2011) to the H2O maser positions and velocities. The dashed line is the symmetry axis of the “mushroom-shaped” H2 line emitting feature in the top right of the figure.
Current usage metrics show cumulative count of Article Views (full-text article views including HTML views, PDF and ePub downloads, according to the available data) and Abstracts Views on Vision4Press platform.
Data correspond to usage on the plateform after 2015. The current usage metrics is available 48-96 hours after online publication and is updated daily on week days.
Initial download of the metrics may take a while.