Press Release
Free Access
Fig. 2
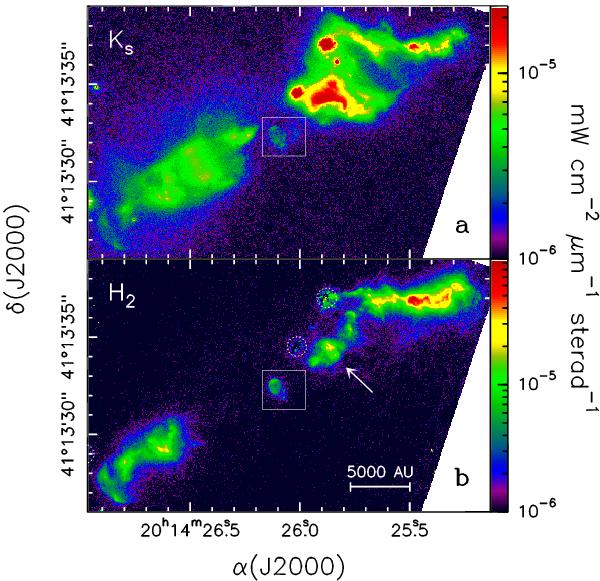
a) Emission in the Ks filter of IRAS 20126+4104. The white rectangle outlines the region displayed in Fig. 5. b) Same as above, for the H2 line emission. The dotted circles indicate artifacts due to residual emission after the continuum subtraction. The arrow points at the “mushroom-shaped” structure shown in Fig. 3.
Current usage metrics show cumulative count of Article Views (full-text article views including HTML views, PDF and ePub downloads, according to the available data) and Abstracts Views on Vision4Press platform.
Data correspond to usage on the plateform after 2015. The current usage metrics is available 48-96 hours after online publication and is updated daily on week days.
Initial download of the metrics may take a while.