Fig. 12
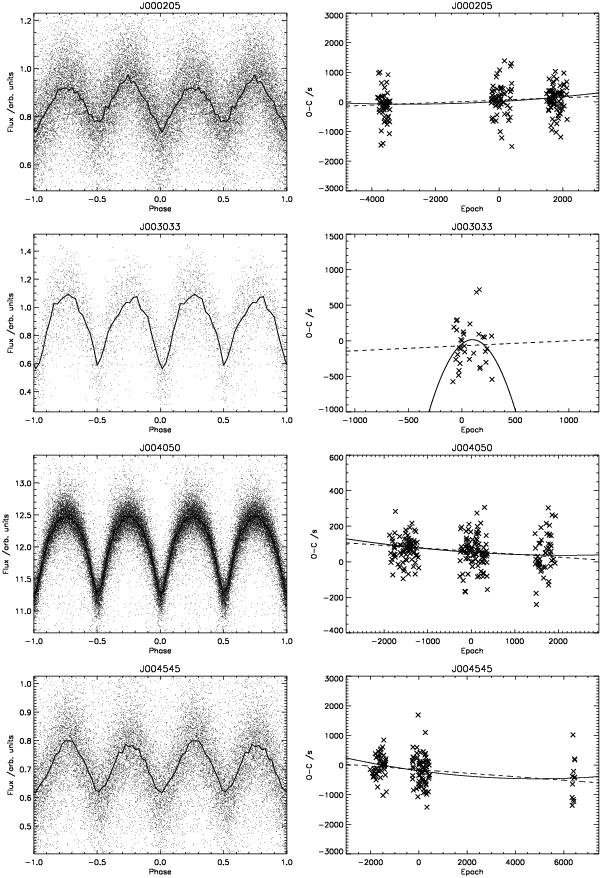
Folded lightcurves (left) and O−C diagrams (right) for 143 objects. On the O−C diagrams, the dotted lines represent the best linear fit to the data, and the solid lines the best quadratic fit. Note that many O−C diagrams represent non-significant period change, or were disregarded due to paucity of data: see Table 1 for significant results.
Current usage metrics show cumulative count of Article Views (full-text article views including HTML views, PDF and ePub downloads, according to the available data) and Abstracts Views on Vision4Press platform.
Data correspond to usage on the plateform after 2015. The current usage metrics is available 48-96 hours after online publication and is updated daily on week days.
Initial download of the metrics may take a while.