Fig. 3
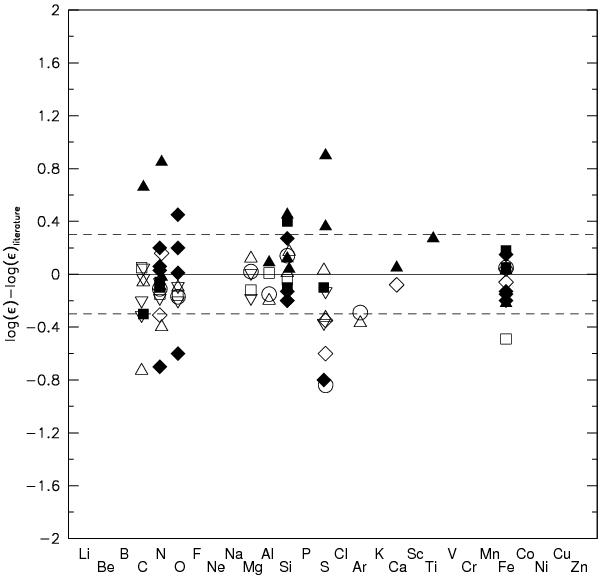
Residuals between the metal abundances determined here and from literature are plotted against the chemical elements. Filled symbols mark results derived from UV-spectroscopy (squares, Fontaine et al. 2006; diamonds, Blanchette et al. 2008; triangles, O’Toole & Heber 2006), open symbols results derived from optical high-resolution spectra (circles, Edelmann et al. 1999; upward triangles, Napiwotzki et al. 2001; squares, Pereira & Jeffery 2008; diamonds, Heber et al. 2000; downward triangles, Przybilla et al. 2006). The dashed horizontal lines mark our statistical uncertainty estimate (± 0.3 dex).
Current usage metrics show cumulative count of Article Views (full-text article views including HTML views, PDF and ePub downloads, according to the available data) and Abstracts Views on Vision4Press platform.
Data correspond to usage on the plateform after 2015. The current usage metrics is available 48-96 hours after online publication and is updated daily on week days.
Initial download of the metrics may take a while.