Fig. 8
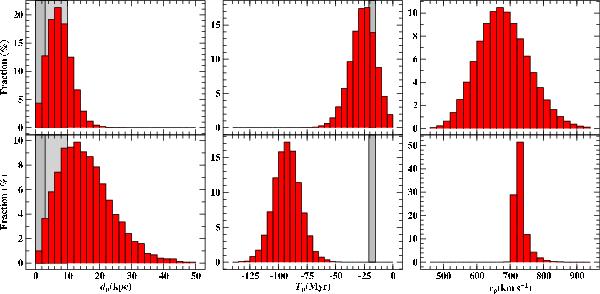
Histograms showing the distribution of distances dp, times Tp, and relative velocities vp at periastron of HE 0437-5439 with respect to the LMC (upper panel, run #3a) and the GC (lower panel, run #3b) for Model III. Mean values and standard deviations are given in Table 5. The gray-shaded areas mark regions with  ,
,  , and 15 Myr ≤ |Tp| ≤ 21 Myr. The last is the lifetime of HE 0437-5439 assuming a single-star nature (Przybilla et al. 2008).
Current usage metrics show cumulative count of Article Views (full-text article views including HTML views, PDF and ePub downloads, according to the available data) and Abstracts Views on Vision4Press platform.
Data correspond to usage on the plateform after 2015. The current usage metrics is available 48-96 hours after online publication and is updated daily on week days.
Initial download of the metrics may take a while.