Fig. 7
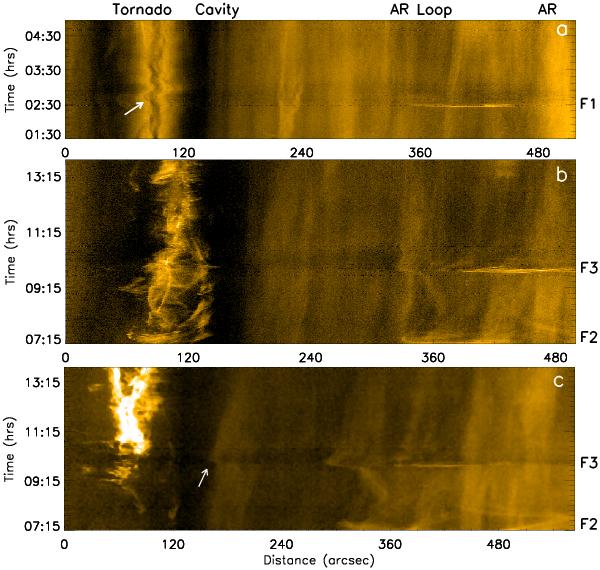
AIA 171 Å intensity time-series along the diagonal arrows in Fig. 6: a) oscillations of the prominence stem triggered by F1 taken along the bottom white arrow; b) activity triggered by F2 and F3 taken along the middle white arrow; c) tornado activity and cavity changes triggered by F2 and F3 taken along the top arrow. The arrow at the time of the flare (~09.40 UT) points to the movement of the cavity boundary.
Current usage metrics show cumulative count of Article Views (full-text article views including HTML views, PDF and ePub downloads, according to the available data) and Abstracts Views on Vision4Press platform.
Data correspond to usage on the plateform after 2015. The current usage metrics is available 48-96 hours after online publication and is updated daily on week days.
Initial download of the metrics may take a while.