Fig. 6
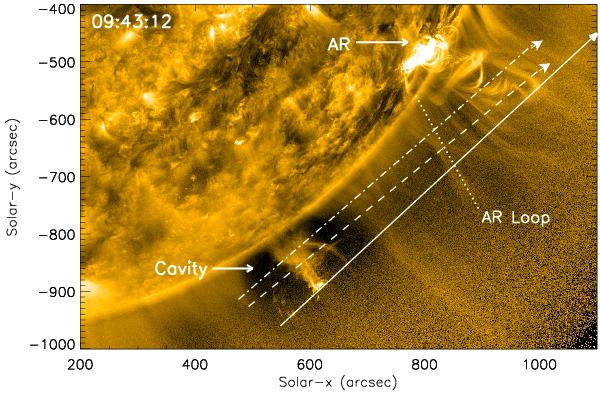
AIA 171 Å intensity image. The diagonal long arrows show the positions of the time-series images through the prominence/tornado, cavity, active region hot loop (AR loop) and active-region (AR) shown in Fig. 7. This is the frame from the movie “MOVIE6b.mp4”. “MOVIE6a.mp4” shows the evolution of this region at earlier times.
Current usage metrics show cumulative count of Article Views (full-text article views including HTML views, PDF and ePub downloads, according to the available data) and Abstracts Views on Vision4Press platform.
Data correspond to usage on the plateform after 2015. The current usage metrics is available 48-96 hours after online publication and is updated daily on week days.
Initial download of the metrics may take a while.