Fig. 2
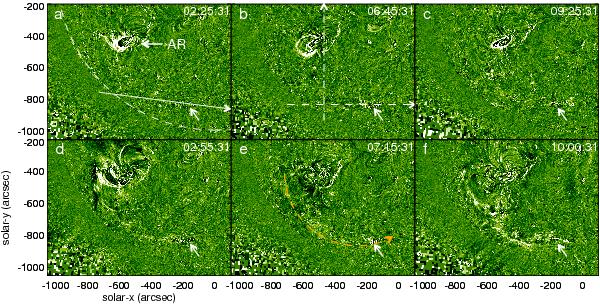
EUVI-A 195 Å running-ratio images showing the onset of the three flares (a), b), and c)) and their associated EUV waves (d), e), and f)). In a) the epipolar line shown in Fig. 1a is drawn as a long white arrow, and the solar limb is drawn as a dashed white line. The small white arrow in all images points to the tornado site. The dot-dashed/dashed lines in b) mark the positions of time series shown in Fig. 4, and the orange dashed line along the EUV wave front in e) is the position of the time series in Fig. 3.
Current usage metrics show cumulative count of Article Views (full-text article views including HTML views, PDF and ePub downloads, according to the available data) and Abstracts Views on Vision4Press platform.
Data correspond to usage on the plateform after 2015. The current usage metrics is available 48-96 hours after online publication and is updated daily on week days.
Initial download of the metrics may take a while.