Fig. 1
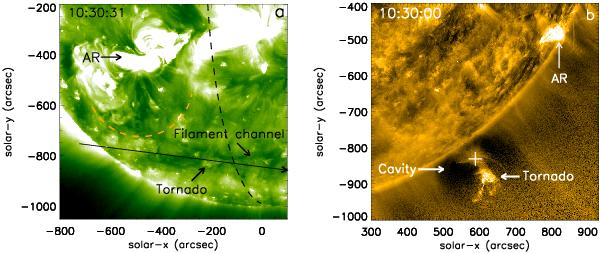
Region around the tornado on 25 September 2011: a) EUVI-A 195 Å; b) AIA 171 Å images. On the EUVI image, the black dashed line shows the position of the AIA limb, and the long diagonal arrow is the epipolar line for the prominence position marked with + on the AIA image. The orange dashed line outlines the position of the southern edge of the active region (AR) corona.
Current usage metrics show cumulative count of Article Views (full-text article views including HTML views, PDF and ePub downloads, according to the available data) and Abstracts Views on Vision4Press platform.
Data correspond to usage on the plateform after 2015. The current usage metrics is available 48-96 hours after online publication and is updated daily on week days.
Initial download of the metrics may take a while.