Fig. 9
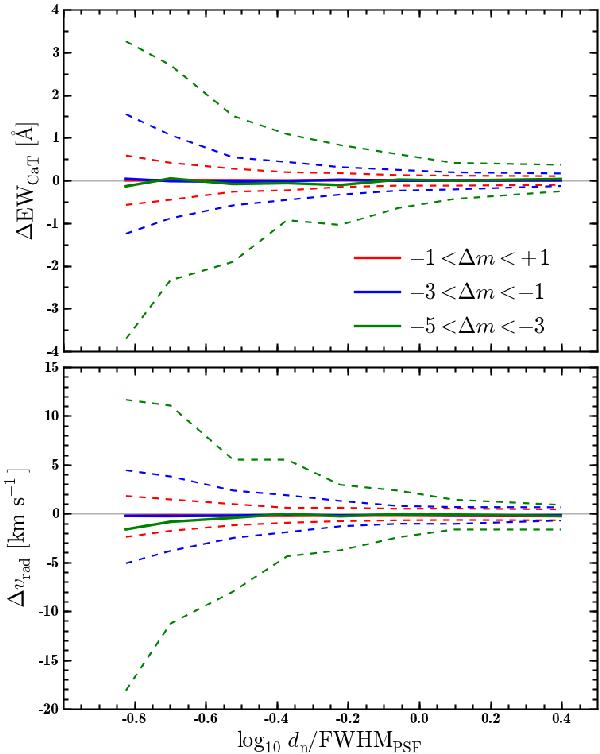
Accuracy in the recovered radial velocities (bottom) and equivalent widths of strong absorption lines (top) for a blended star, as a function of source separation and for different flux ratios. The lines depict the median velocity difference (measured − true, thick solid) and the 75% percentiles (thin dashed) for a distribution of 1000 stellar pairs per separation value.
Current usage metrics show cumulative count of Article Views (full-text article views including HTML views, PDF and ePub downloads, according to the available data) and Abstracts Views on Vision4Press platform.
Data correspond to usage on the plateform after 2015. The current usage metrics is available 48-96 hours after online publication and is updated daily on week days.
Initial download of the metrics may take a while.