Fig. 8
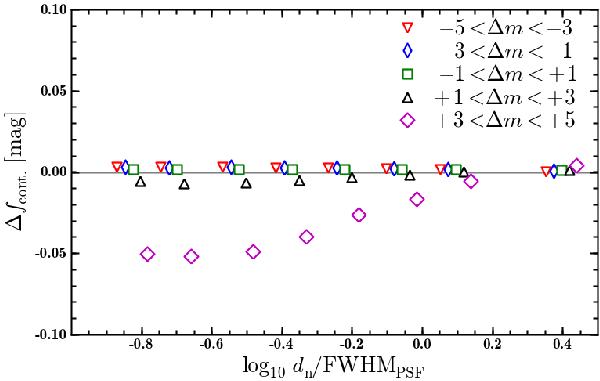
The average error in the continuum level of the deblended spectra (expressed as a magnitude difference) as a function of the distance of the source to a neighbour (again normalized to the width of the PSF) and its relative brightness. As in Fig. 7, datapoints for different flux ratios are plotted with small horizontal offsets for clarity.
Current usage metrics show cumulative count of Article Views (full-text article views including HTML views, PDF and ePub downloads, according to the available data) and Abstracts Views on Vision4Press platform.
Data correspond to usage on the plateform after 2015. The current usage metrics is available 48-96 hours after online publication and is updated daily on week days.
Initial download of the metrics may take a while.