Fig. 6
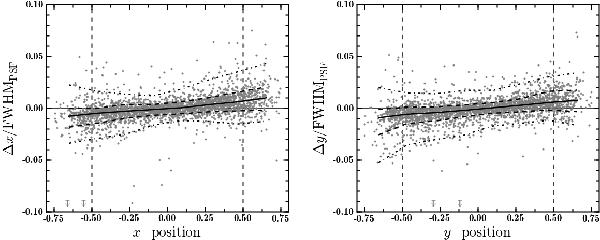
Comparison between the recovered and true source coordinates for the sources in 100 simulated crowded field datacubes, expressed as the mean deviation in x- and y-direction relative to the FWHM of the PSF as a function of the position of each source, in units of the FoV size. Dashed vertical lines indicate the FoV edges. The median deviation along x and y is marked by a solid black line, the 68.3% and 95.4% percentiles of both distributions are indicated by the dotted and dashed black lines, respectively. A few outliers are out of the plotted range and indicated by upper limits.
Current usage metrics show cumulative count of Article Views (full-text article views including HTML views, PDF and ePub downloads, according to the available data) and Abstracts Views on Vision4Press platform.
Data correspond to usage on the plateform after 2015. The current usage metrics is available 48-96 hours after online publication and is updated daily on week days.
Initial download of the metrics may take a while.