Fig. 4
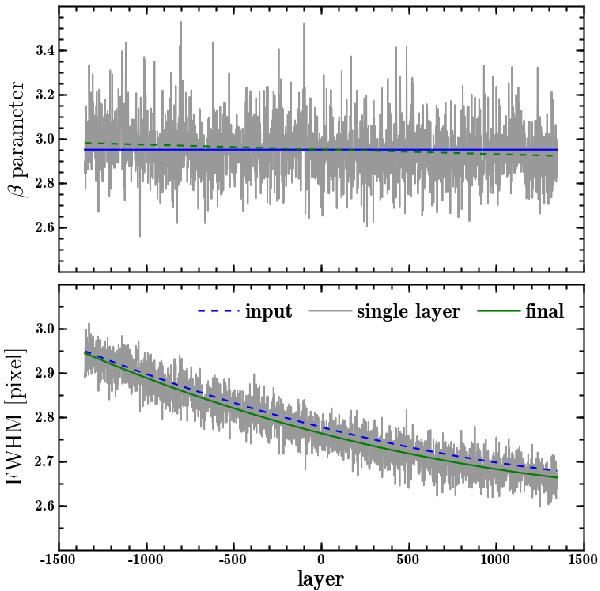
Example for the recovery of the PSF in a datacube. Shown is the accuracy of the recovered PSF parameters β (top) and FWHM (bottom) in comparison to their true values (blue dashed line). The grey solid line gives the best-fit values of the PSF parameters obtained in each layer and the final parameters of the PSF model obtained from these values are shown as a solid green line. The analysis was started at the central image of the datacube and proceeded simultaneously to the red and blue ends of the cube.
Current usage metrics show cumulative count of Article Views (full-text article views including HTML views, PDF and ePub downloads, according to the available data) and Abstracts Views on Vision4Press platform.
Data correspond to usage on the plateform after 2015. The current usage metrics is available 48-96 hours after online publication and is updated daily on week days.
Initial download of the metrics may take a while.