Fig. 2
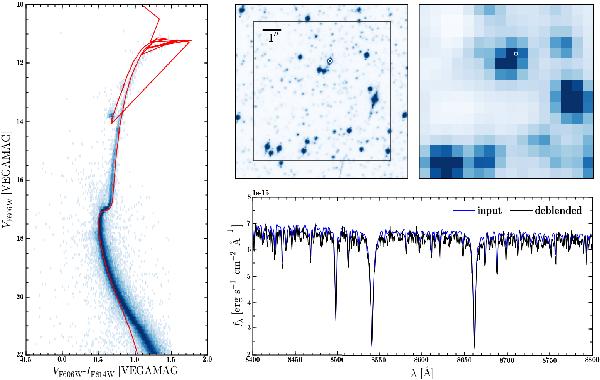
Illustration of how the simulated data was produced and processed. Left panel: input color–magnitude diagram of 47Tuc. Overplotted is the isochrone that was used to assign spectra to the individual stars. Upper panels: cut-out from an HST image of 47Tuc (upper middle); whitelight image of a simulated crowded field datacube centred on the HST footprint (upper right). The lower right panel shows the deblended spectrum of the star marked with a white circle. The input spectrum of this star is overplotted.
Current usage metrics show cumulative count of Article Views (full-text article views including HTML views, PDF and ePub downloads, according to the available data) and Abstracts Views on Vision4Press platform.
Data correspond to usage on the plateform after 2015. The current usage metrics is available 48-96 hours after online publication and is updated daily on week days.
Initial download of the metrics may take a while.