Free Access
Fig. 19
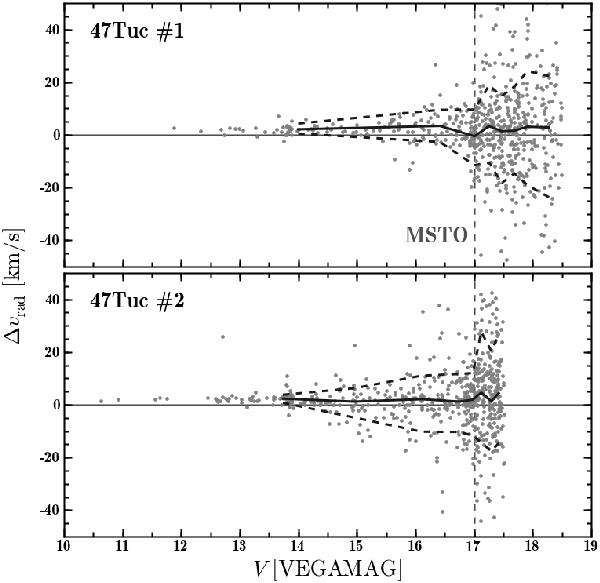
Deviation of the radial velocities determined from the deblended spectra, again plotted as a function of a star’s brightness for the two fields highlighted in Fig. 16. Radial velocities were determined by cross-correlating each deblended spectrum with its input spectrum. The line types are as in Fig. 18.
Current usage metrics show cumulative count of Article Views (full-text article views including HTML views, PDF and ePub downloads, according to the available data) and Abstracts Views on Vision4Press platform.
Data correspond to usage on the plateform after 2015. The current usage metrics is available 48-96 hours after online publication and is updated daily on week days.
Initial download of the metrics may take a while.