Fig. 18
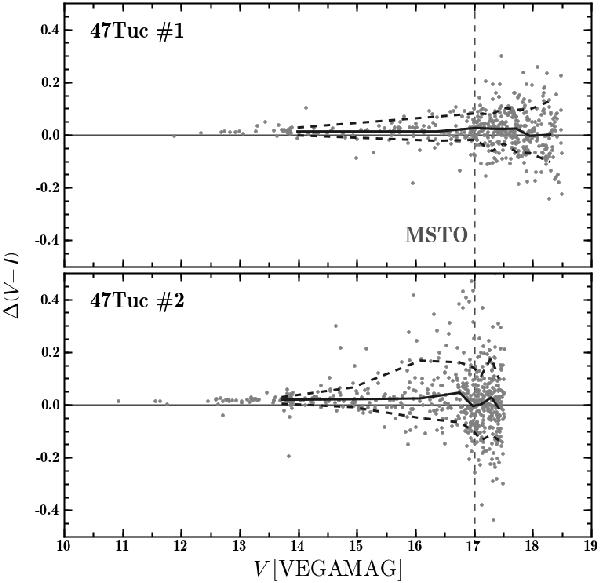
Deviation in V − I color recovered from the deblended spectra as a function of a stellar magnitudes for the two subfields highlighted in Fig. 16. The median of the distribution is shown as a thick solid line, dashed lines give the 75% percentiles of the distribution. A vertical dashed line is used to indicate the main-sequence turn-off in both panels.
Current usage metrics show cumulative count of Article Views (full-text article views including HTML views, PDF and ePub downloads, according to the available data) and Abstracts Views on Vision4Press platform.
Data correspond to usage on the plateform after 2015. The current usage metrics is available 48-96 hours after online publication and is updated daily on week days.
Initial download of the metrics may take a while.