Fig. 17
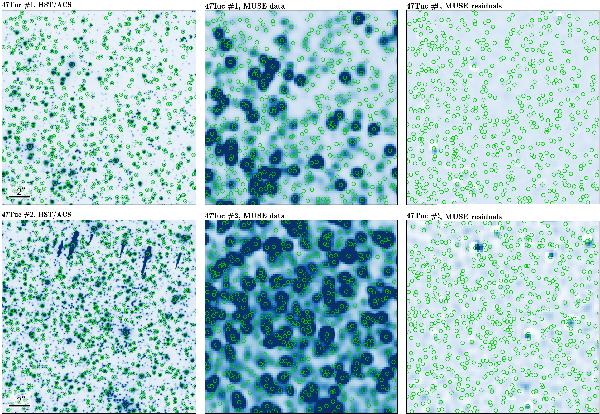
Visualization of our source deblending algorithm applied to simulated MUSE data. For each of the two fields highlighted in Fig. 16, we show a cut-out from an HST/ACS image (left), a white light image of the simulated data (centre), and a residual image after fitting the sources (right). Each location where a useful spectrum was deblended has been marked by a green circle.
Current usage metrics show cumulative count of Article Views (full-text article views including HTML views, PDF and ePub downloads, according to the available data) and Abstracts Views on Vision4Press platform.
Data correspond to usage on the plateform after 2015. The current usage metrics is available 48-96 hours after online publication and is updated daily on week days.
Initial download of the metrics may take a while.