Fig. 11
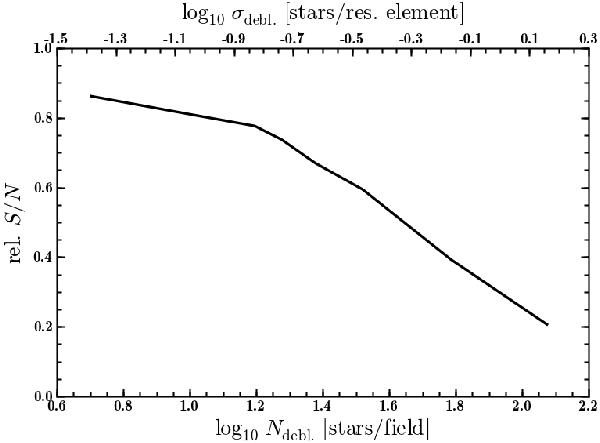
Estimated S/N of extracted spectra as a function of the number of deblended stars per field or per resolution element, respectively, again using the 10 brightest stars per simulated cube. The thick solid line indicates the median of the distribution. As in Fig. 7, we show the ratio of the S/N measured in a deblended spectrum and that expected based on Eq. (16).
Current usage metrics show cumulative count of Article Views (full-text article views including HTML views, PDF and ePub downloads, according to the available data) and Abstracts Views on Vision4Press platform.
Data correspond to usage on the plateform after 2015. The current usage metrics is available 48-96 hours after online publication and is updated daily on week days.
Initial download of the metrics may take a while.